
))
64 | “Dear Data” with Giorgia Lupi and Stefanie Posavec
Archivierte Serien ("Inaktiver Feed" status)
When?
This feed was archived on May 04, 2021 22:07 (
Why? Inaktiver Feed status. Unsere Server waren nicht in der Lage einen gültigen Podcast-Feed für einen längeren Zeitraum zu erhalten.
What now? You might be able to find a more up-to-date version using the search function. This series will no longer be checked for updates. If you believe this to be in error, please check if the publisher's feed link below is valid and contact support to request the feed be restored or if you have any other concerns about this.
Manage episode 188411189 series 1589769
Inhalt bereitgestellt von Aushängeschilder. Alle Podcast-Inhalte, einschließlich Episoden, Grafiken und Podcast-Beschreibungen, werden direkt von Aushängeschilder oder seinem Podcast-Plattformpartner hochgeladen und bereitgestellt. Wenn Sie glauben, dass jemand Ihr urheberrechtlich geschütztes Werk ohne Ihre Erlaubnis nutzt, können Sie dem hier beschriebenen Verfahren folgen https://de.player.fm/legal.
- Download:
- MP3 Audio32 MB
- MPEG-4 AAC Audio26 MB
Hey folks,
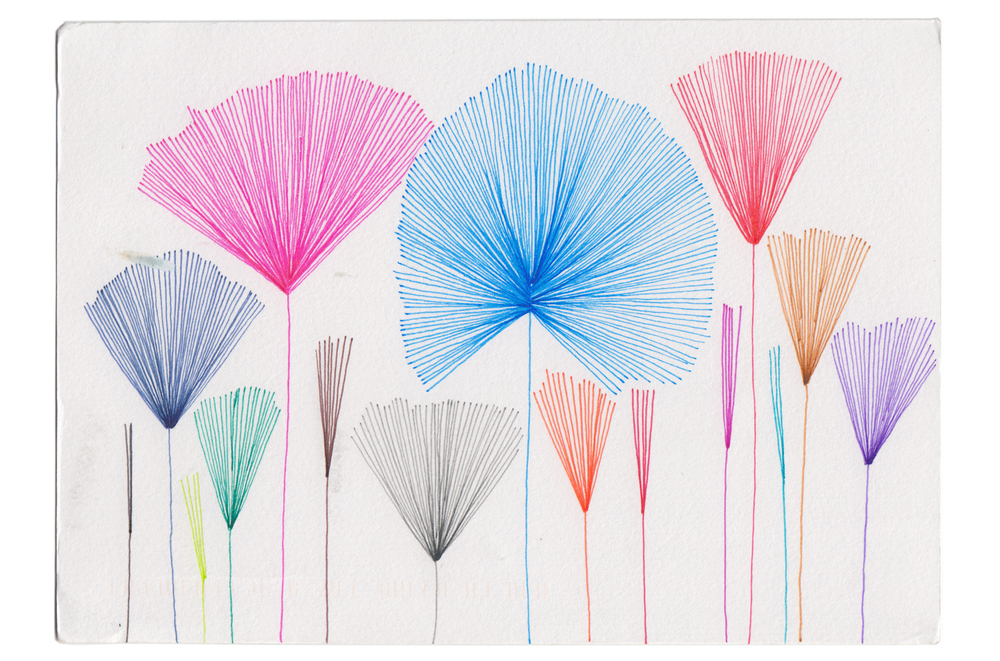
It’s time for another project-centric episode, and we finally talk about one of our favorite projects of the year ? “Dear Data” by the most fabulous tag team of data illustrators around: Giorgia Lupi and Stefanie Posavec.

Their year-long project is about how “two women who switched continents get to know each other through the data they draw and send across the pond” and consists of 104 hand?drawn postcards all of which document one week of their lives. How much they cursed, laughed, read, smiled at strangers, ? ? all of this is documented in inventive, charming and very analogue ways.
Learn all about the project ? how they started it, what they learned, and how it will live on ? in the episode.
Links mentioned:
- Yay for slow data!
- Reporter app: http://www.reporter-app.com/
- Notebook app: http://www.notebooksapp.com/
And read the episode transcript here!
Data Stories is brought to you by Qlik, who allow you to explore the hidden relationships within your data that lead to meaningful insights. Check out this fun experiment on the qlik blog: “What Chart are You?”. And, make sure to try out Qlik Sense, which you can download for free at www.qlik.de/datastories.
Related episodes
- 87 | VizKidz: Books on Data Visualization for Kids
- 88 | Re-designing Visualizations on #MakeoverMonday with Andy Kriebel and Andy Cotgreave
- 109 | Feminist Data Visualization with Catherine D?Ignazio
- 93 | OddityViz with Valentina D?Efilippo and Miriam Quick
- 98 | Data Sketches with Nadieh Bremer and Shirley Wu
- 103 | Explorable Explanations with Nicky Case
- 112 | Data Pottery with Alice Thudt
59 Episoden


